
Patricia Quinn, MD Benefacts
It’s too early to say what will be the impacts of Covid-19 for Irish nonprofits but it’s certain that the social economy, like every other part of the economy, is going through convulsive change. As we start learning how to live with the new coronavirus, the work of nonprofits – especially their importance as providers of essential supports to vulnerable communities – has come into clearer view.
But health and social care providers are not the only nonprofit sectors affected. The performing arts have been decimated. Fund-raising has fallen off a cliff. Those 29,700 people that work for micro entities – mostly small local nonprofits with few assets and little or no secure funding from any source – must feel very vulnerable indeed.
When the economic consequences of the coronavirus for the sector started to become clear, people asked for data to help decision-makers to tackle the emerging problems. How many people are working in the sector, and in what sub-sectors? What is the profile of dependence on donations and grants?
Will this recognition of the sector and its value endure after the acute stage of the crisis has passed? As we write this, public statements by political leaders acknowledge the needs of other indigenous sectors in the economy – tourism, agriculture, retail, hospitality. The nonprofit sector is markedly absent from this roll call, notwithstanding its incalculable contribution to the wellbeing of our society, nor to speak of its scale and reach as an employer and provider of services.
Benefacts harvests the sector’s own public disclosures to make the work of Ireland’s nonprofit sector more accessible and more transparent. Here are the headline findings from our 2020 benchmark analysis of the sector using data available at the end of 2019.
The latest financial data shows a year of growth, with most of the increased turnover, State funding, employment and asset base concentrated in medium and large nonprofits
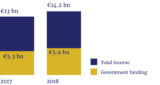
Income and State funding for nonprofits
Source: Benefacts
In the sector at large, the story is one of growth – increases in State support, in fund-raised income, in numbers employed, and in the number of new incorporations. But this is very unevenly distributed across the sector.
The aggregate turnover of the sector at large grew by 9.5% from €13bn to €14.2bn – but most of this growth was in medium or large organisations, and most of that came from increased State funding to higher education and health/social care (“Section 38” bodies).
Fundraised income across the sector grew by 6%, almost entirely among large nonprofits in the health, higher education and international development aid sectors.
The number of people employed in Irish nonprofits increased from 154,900 to 165,100, almost half of these increased number employed in medium and large State-funded charities, where staff enjoy the same employment conditions as public servants.
Outside of this group, there were an additional 5,500 jobs reported in local development, social services, education, recreation & sport.
Profile of incorporation of nonprofit companies by decade
Source: Benefacts
Within the group of small, medium and large nonprofits, 90% have been in existence for more than 10 years, most for 30 years or more.
Micro nonprofit companies by contrast are considerably younger, with nearly 25% established in the last 10 years.
Nonprofit startups outnumber wind-ups nearly 2:1
The net change in the number of nonprofit companies established during the year was also one of growth – 540 new incorporations versus 279 dissolutions although 17 of these wind-ups were local money advice bureaux and 26 were local citizens information offices, reflecting a rationalisation introduced by Citizens Information.
Nonprofit startups and wind-ups 2018
Source: Benefacts

Stephen Kinsella
Associate Professor of Economics, University of Limerick
There’s never a good time to have a pandemic, but we have learned that it helps to have a stable income and a back garden. The social economy has nearly 30,000 people working in its micro entities, and whatever about their back gardens, they do not enjoy stable incomes. And as their incomes shrink, the complex needs they address in society grow. Absent the state’s intervention, a large section of these groups, from housing and the arts to environment, advocacy and social services, are likely to struggle. Some will fail.
The Benefacts database is a rare thing in Ireland’s political and economic life. It gives us a database of behaviour at the level of the organisation itself, with everything from turnover to full time employees to governance structure. The database is searchable. As you will see from this report, the data are beautifully presented. In the 21st Century we require policy to be made using rigorous evidence informing politicians and civil servants. Benefacts is that evidence for a vital part of our economy. A comparable database of private sector firms, or even just the banking sector, would be worth its weight in gold.
Consider what we know now, thanks to Benefacts, that we did not know before. We know:
- Social economy firms are remarkable durable relative to the business cycles Ireland is prone to.
- The micro and tiny organisations generate some €4.2 billion in turnover, with only 42% of their revenue coming directly from the state.
- The state has been increasing its support for organisations in this area over recent years. Given the good work they undoubtedly do, this is a very good thing.
- The organisations in the sector are truly tiny entities, in the main. There is scope for policy to work to increase the scale of these organisations to increase their effectiveness.
Crucially, we also know what we don’t know. We don’t know about the finances of more than 22,000 organisations that matter deeply in our society, some of which the state funds: our schools, associations, and clubs. Benefacts helps policy makers make a very strong argument: To support these sectors more, we need to know more.
There is nothing better than data to help us make better decisions. Benefacts provides us with this, while reminding us that we live in a society, not an economy. The economy is a subset of, and serves, society. These organisations are, in a sense, at the border of the economy and society. In the main they make life better. We have a good sense of how much better now, thanks to this release. I am very happy to see this report online and look forward to learning as much as I can from the database over the coming months.
Irish nonprofits – by the numbers
| Turnover | Number of nonprofits | Of which charities | Aggregate turnover € | Reported FTE employees |
| More than €40m | 60 | 54 (90%) | 8,173,452,484 | 74,547 |
| Between €12m and €40m | 85 | 72 (85%) | 1,748,545,459 | 15,836 |
| Between €700,000 and €12m | 1,275 | 1,021 (80%) | 3,121,384,858 | 44,985 |
| Between €250,000 and €700,000 | 1,890 | 1,162 (61%) | 779,912,543 | 21,980 |
| Less than €250,000 | 7,047 | 4,270 (60%) | 408,378,658 | 7,727 |
| Unknown – no source of financial data Unknown (newly-founded nonprofit companies) | 22,484 | 4,164 (19%) | ||
| Total | 32,841 | 10,743 (33%) | 14,231,674,002 | 165,075 |
Source: Benefacts
Ireland’s nonprofit sector has many very small, and few larger organisations.
The financial data is limited to 10,357 organisations whose accounts are publicly available. 64% of these are registered charities.
Missing from our financial analysis of the sector are more than 22,484 local nonprofits – mostly schools, parishes, associations and clubs which don’t publish accounts or for which there is no regulatory source of financial data.
Large nonprofits
Only 60 Irish nonprofits are “large”, with a turnover in excess of €40m. These are mostly mature, established nonprofit companies, trusts or charter bodies including 22 higher education institutions, 14 hospitals or hospices, a couple of international development aid charities, major sports bodies, one Roman Catholic diocese, one philanthropy and some of the major providers of social care and disability services. 90% are registered charities.
Employment in this group grew by 4% to 74,500, with an average number of 1,300 employees per entity. This is the segment with the highest number of higher paid people (9,106), reflecting the inclusion of a number of universities and S.38 health and social care providers.
Aggregate turnover within this segment increased from €7.5bn to €8.2bn. The majority of these nonprofits rely on revenues from Government grants or fees, representing an aggregate €4bn of income – an increase of 11% on the previous year. Fundraised income grew by 15%.
Medium nonprofits
85 medium nonprofits – with a turnover between €12m and €40m – are predominantly social care providers (20) religious congregations or dioceses (14), healthcare providers (22), higher education institutions (6), professional associations, international development aid or social housing providers. 85% are registered charities.
Employment in this group grew by 11.5% to 15,800, with an average number of 240 employees per entity. Reported higher paid employees number 493.
Aggregate turnover within this segment increased by 11% to €1.8bn, and reported revenues from Government grants or fees were €0.7bn – an increase of 10% on the previous year. Fundraised income grew by 7%.
Small nonprofits
1,275 small nonprofits – with a turnover between €700,000 and €12m – include larger arts, sports and heritage venues and companies, health, homelessness local development, social care and overseas development aid NGOs, Leader/Partnership companies, private schools, sports governing bodies, social housing providers, larger professional institutes, hospital and university fundraising foundations, many dioceses, religious orders and congregations, political parties.
Employment in this group grew by 8.5% to 45,000, with an average number of 41 employees per company. Within this group, 482 people are higher paid.
Aggregate turnover (based on available disclosures) increased by 9% to €3.1bn, and revenues from Government grants or fees amounted to 42% of reported income – an increase of 22% on the previous year. Fundraised income was flat year-on-year at €0.4bn.
Micro entities
Most micro nonprofits are tiny: 7,047 operate on an annual turnover of €250,000 or less, and another 1,890 on between €250,000 and €700,000 – which is the threshold defined in law for “micro enterprises”.
They include a very diverse range of entities including social enterprises, network, campaigning or advocacy organisations, agricultural shows, environmental or animal welfare organisations, local development associations, creches, local care providers and disability service providers, youth clubs and family resource centres, arts or craft companies and sports clubs, charity shops, churches, festivals, housing associations, chambers of commerce, professional institutes, group water schemes, fundraising charities and small foundations.
Employment in micro enterprises grew by 6.7% to 29,700 – although only 46% of those for which we have data report having any employees at all. Within this group, 34 people are higher paid.
Micro enterprises are now permitted to file very limited financial statements and 12% do, with a further 50% filing abridged accounts. Based on the limited information available, aggregate turnover increased by 9% to €1.2bn over the previous year, and reported revenues from State grants or fees represented 43% of income.
Where does all this data come from?

Benefacts provides data-driven analysis and analytics to nonprofits and their stakeholders. Our database is extensive, but is only as good as the disclosures of nonprofits and their regulators. The most recent data is digitised, aggregated and summarised here on this free searchable public website, in the form of listings for each non-profit, and a sector-wide analysis report which we update annually in Q1 as soon as the full set of the latest year’s filings comes to hand. Our 2020 report is here.
Benefacts’ data is always historic. For accountability purposes, nonprofits may provide their funders with interim management accounts, but we rely on the directors’ reports adopted corporately and filed annually, up to ten months after their financial year-end. This means the financial and employment data reported on here is based on the full population of 2018 data from financial statements filed during 2019 (governance data is current).
We define “nonprofits” as more than registered charities. We include civil society organisations like political parties, professional bodies, chambers of commerce, trades unions and sports organisations – all excluded from the definition of a charity in law. We also include about 20,000 local nonprofits not listed on the register of charities.
We don’t include about 40 State agencies (like the Arts Council and the Health Services Executive) which were automatically added to the Charities Register when this was created in October 2014, but which don’t conform with the definition of a nonprofit.